

By Adam Baley
One of the most tried and true tests of relative value for investors is to compare the market’s earnings yield against what bonds pay, to assess if stocks are overvalued or undervalued.
The extra return investors expect for holding stocks over safer government bonds has essentially vanished this year, hitting its lowest levels since the dot-com bubble. And this phenomenon reshapes how investors ought to view risk and reward.
We measure the stock market’s earnings yield by taking the reciprocal of the price-to-earnings ratio (P/E); in this case, we divide earnings into today’s prices. And at today’s prices, the earnings yield on the S&P 500 is about 4.5%. That’s the same as the yield on the 10-year U.S. Treasury bond.
Simply put, this measure of the expected return of stocks is now the same as what ultrasafe government bonds will yield.
That’s rare, as investors usually demand a higher earnings yield on stocks to put up with all the volatility that comes with owning equities. The gap between the earnings yield of stocks and bonds has now disappeared, a phenomenon that has historically portended poor stock market returns.
The squeeze
This premium has evaporated because soaring stock valuations have compressed the S&P 500’s earnings yield, while the 10-year U.S. Treasury yield has climbed amid persistent inflation. This has resulted in many cases where stocks are offering similar or even worse yields than bonds.
The squeeze has not been without reason. Investors have piled into stocks at an enthusiastic pace, led by the profit explosion from the AI boom these past five years. Wall Street even coined the phrase “There is no alternative to stocks,” or TINA. Now, several years into the AI build-out, AI-related profits have soared. Current valuations would require continued massive, multiyear earnings growth that may be difficult to sustain, especially with today’s higher input and borrowing costs.
Historical perspective
Candidly, this indicator of relative value has zero predictability when applied to short periods of time, so your guess is as good as mine for the coming months. What’s interesting is how accurate the measure is over meaningful periods of time, say five years.
I’m a student of market history, so I like to look back and cite chapter and verse when we’ve been here before and what came next. Looking back to when the market traded at similar levels as today, the subsequent five-year annualized return has been close to 0%.
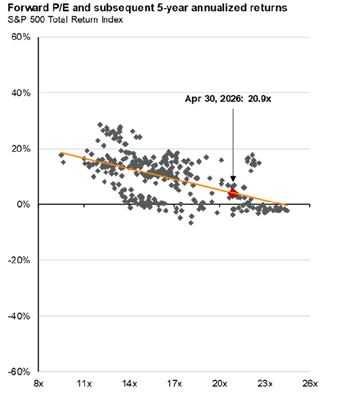
The chart shows us what we know intuitively — if you overpay for stocks, don’t expect much return going forward.
Investment implications
Temper your enthusiasm. At the very least, this gauge gives investors pause to reassess risk in their portfolio. With stocks near all-time highs and valuations stretched, consider reducing risk. It’s hard to ignore the compelling returns in safer assets, as we now have that alternative to stocks Wall Street once chided us about. Cash, for example, is yielding 3%–4% these days. Ten-year U.S. Treasury bonds are yielding 4.5%, and similar quality corporate bonds are yielding around 5.5%.
In my world, when something is expensive, it’s also vulnerable to a decline. Lofty stock prices and risk are forever intertwined. Fixed income offers legitimate, competitive yields, making the choice to take additional equity risk less rewarding.
While the risk premium on stocks may be performing a vanishing act, don’t let the opportunity to reassess risk in your portfolio disappear along with it.