By Adam Baley
“The doctor will see you now,” the nurse said as we walked into the next room. It’s my annual checkup, and I know the drill, so I sat down and rolled up my sleeve. “Let’s check your vitals,” she said. “Then the doctor will be in shortly.”
We check vitals because they assess basic health and provide crucial information about the body’s core functioning. They also identify potential problems.
As investors, we check vitals of the market and economy – corporate earnings the pulse, the yield curve the blood pressure.
Since the 1980s, investors have looked to the yield curve as a leading indicator. It compares current yields on U.S. Treasury bonds at varying lengths. Essentially, the yield curve offers a real-time look at market health and what to expect in one, three, five and even 10 years.
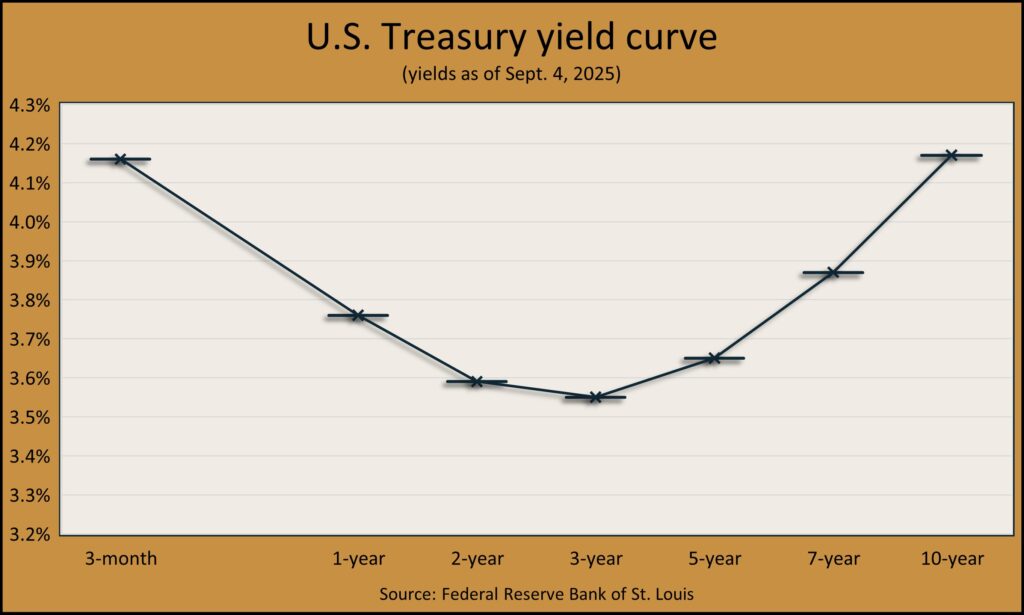
Recently, this vital indicator has been flashing a sign that’s rarely seen: A U-shaped curve.
Learn more
Yield curve: The shape of interest rates, a Money Talk Video with Kyle Tetting
Leaning into the curve, by Joel Dresang
The data behind the fear of yield curve inversions,from the Federal Reserve Bank of St. Louis
Bond Yield and Return, from the Financial Industry Regulatory Authority
Types of yield curves and what they suggest
Similar to how a person’s blood pressure can help assess a patient’s health, the yield curve provides an indication of how the economy is doing. The shape of the curve can identify potential problems.
- Upward slope. That’s normal, prevailing 80% of the time, according to a Federal Reserve report. Shorter rates are lower and longer rates are higher. It signals a healthy and growing economy.
- Flat. With a flat yield curve, short-term and long-term rates are about the same. That typically happens toward the end of a business cycle and indicates both slowing growth and inflation. Historically, flat yield curves occur about 8% of the time.
- Inverted. The curve slopes downward, with shorter rates higher and longer rates lower. That suggests a problem somewhere in the credit markets and hints that a recession could be on the horizon. Inverted yield curves happen about 10% of the time.
- U-shaped. The curve forms a U when short-term rates are higher than rates for bonds maturing in two to five years, and then rates rise again for longer-term holdings, as investors demand a higher yield because of perceived risks. The U-shape that started forming in early 2025 simultaneously reflects nearer-term concerns of recession against long-term worries of persistent inflation.
Concerns about the rare U-shaped curve
A U-shaped yield curve is akin to a plunge in blood pressure followed by an immediate surge. It’s a rare occurrence seen only a handful of times in the past 50 years. It’s concerning because historically it has coincided with significant financial disruptions.
For instance, a U-shaped curve appeared in 1998 during the Asian financial crisis, then in 2000 as the dot-com bubble was bursting, then again in 2007 when the credit markets started to seize up ahead of the 2008 financial collapse. The last U-shaped yield curve showed up in late 2019, just before the COVID-induced recession.
I must admit, the U-shaped curve has an uncomfortable record to recount. So, what is the prognosis this time around?
First, understand that the U-shaped curve is not the disease itself. It’s a symptom suggesting problems existing somewhere in the credit markets. Second, although unlikely, it could possibly be a false positive.
We already know that the yield curve has a history of sending false signals. For instance, we had an inverted yield curve without a recession in 1966, 1998 and 2022. Still, all three of those periods experienced significant market turbulence. So even though there wasn’t an economic downturn, investors felt the pain of a portfolio recession.
U-shaped curve is not a worldwide phenomenon
The 2025 U-shaped yield curve appears to be exclusively a U.S. phenomenon and does not seem to be contagious. Other developed markets – like Europe and Japan – currently have normal, healthy curves. U.S. issues do not appear to have spread to other global bodies, suggesting credit markets elsewhere remain healthy in other areas of the globe.
How a U-shaped curve is resolved
Resolution is simple: One end of the yield curve surrenders. Either long rates move higher because inflation heats up, or short-term rates move lower because economic activity runs cold.
While it is possible for long rates to move higher, previous U-shaped curves have been resolved by a collapse in short-term rates coinciding with a collapse in economic activity.
What investors should do
First, there are more important things in life than money, and your health is one of them. You should check your blood pressure more than you check your portfolio.
After that, balance remains the best antidote to uncertainty, including uncertainty over what, if anything, the U-shaped yield curve is telling us.
With stock valuations near all-time highs, now is a wonderful time to consider rebalancing your portfolio and reducing risk.
More specifically, avoid the extreme ends of the yield curve in your bond portfolio. Instead, stay in the attractive middle ground. Hold enough cash for planned distributions in the next couple of years with the bulk of your bond portfolio in maturities of two- to four years.
Adam Baley is a vice president and investment advisor at Landaas & Company, LLC.