
Money Talk Podcast, Friday July 26, 2019

Podcast: Play in new window | Download
Subscribe: iTunes | Android | Google Play | RSS
Landaas & Company newsletter April edition now available.
Advisors on This Week’s Show
Kyle Tetting
Brian Kilb
Art Rothschild
Adam Baley
(with Max Hoelzl and Joel Dresang)
Week in Review (April 22-26, 2019)
Significant economic indicators & reports
Monday
No major releases or announcements
Tuesday
Existing home sales for June fell 1.7% to an annual pace of 5.27 million houses, down 2.2% from the year-earlier rate, according to the National Association of Realtors. The trade association blamed an ongoing imbalance between demand and supply, with low inventories of houses for sale in the lower and middle price ranges. The median selling price rose 4.3% from June 2018, the 88th month in a row for higher year-to-year price gains.
Wednesday
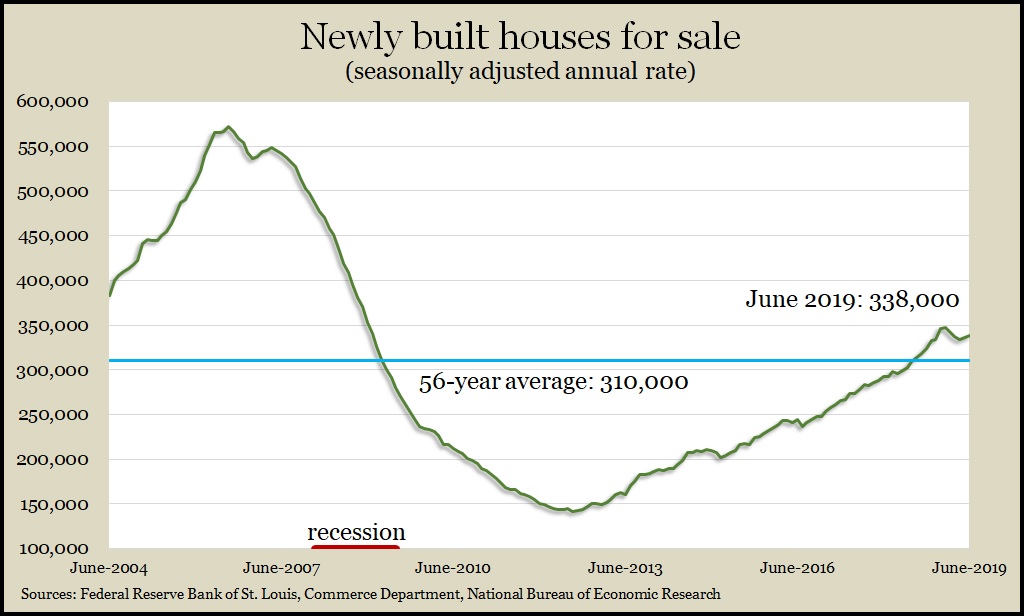
New home sales rose in June, although less than analysts had expected. The nation sold an annualized rate of 646,000 new houses in June, up 7% from May and up 4.5% from June 2018, the Commerce Department reported. Sales fell in the Northeast and Midwest, both for the month and the 12 months. The median sales price declined 0.3% from June 2018. Although the sales rate is within 10% of the post-recession high, it is less than half of the peak pace set in 2005. Likewise, the inventory of newly built houses for sale is near its highest level in years but still far below where it was just before the recession.
Thursday
The four-week moving average for initial unemployment insurance claims fell for the third week in a row, hovering around the lowest level since late 1969. According to data from the Labor Department, initial claims were 40% below the 52-year average, which is a good indication of employer reluctance to let workers go and a sign of a tight labor market. Strong employment factors tend to encourage consumer spending, which generates about tw0-thirds of U.S. economic activity.
Durable goods orders rose in June by 2% after declining for the two previous months. Demand for aircraft and automotive products led the way, according to the Commerce Department. Excluding volatile transportation orders, new orders increased for the second month in a row. Year-to-year, orders for durable goods were unchanged, vs. 1.1% excluding transportation. A proxy for investments made by businesses rose for the second month in a row and was up 1.9% from June 2018.
Friday
Real gross domestic product increased at an annual rate of 2.1% in the second quarter, down from 3.1% in the first three months of the year and the slowest second quarter in three years. Accelerated consumer spending led the latest spurt of economic growth, and a 7.9% rate of increased federal government spending helped. Offsetting factors included declines in business investments and exports and inventory buildups. Housing investments fell for the sixth quarter in a row. The Federal Reserve Board’s preferred inflation gauge—the core PCE price index—rose at a 1.8% annual pace, suggesting stronger economic growth than the 1.1% reading in the first three months of the year.
Market closings for the week
- Nasdaq – 8,330, up 184 points or 2.3%
- Standard & Poor’s 500 – 3,026, up 49 points or 1.7%
- Dow Jones Industrial– 27,192, up 38 points or 0.1%
- 10-year U.S. Treasury Note – 2.08%, up 0.03 point
Send us a question for our next podcast.
Not a Landaas & Company client yet? Click here to learn more.
More information and insight from Money Talk
Money Talk Videos
Follow us on Twitter.